Exploring all data from a tissue in the Census
The Census is a versioned container for the single-cell data hosted at CELLxGENE Discover. The Census utilizes SOMA powered by TileDB for storing, accessing, and efficiently filtering data.
This notebook shows you how to learn about the Census contents and how to query it.
This notebook provides a demonstration for:
Learning about the lung data.
Learning about cells of lung data.
Larning about genes of lung data.
Fetching all human lung data from the Census.
Obtaining QC metrics for this data slice.
Learning about the lung data in the Census
First we open the Census, if you are not familiar with the basics of Census API you should take a look at notebook “Learning about the CELLxGENE Census” at comp_bio_census_info.ipynb.
[1]:
import cellxgene_census
import scanpy as sc
import pandas as pd
import numpy as np
from scipy.sparse import coo_matrix

census = cellxgene_census.open_soma()
Let’s first take a look at the number of cells from human lung:
[2]:
summary_table = census["census_info"]["summary_cell_counts"].read().concat().to_pandas()

summary_table.query("organism == 'Homo sapiens' & category == 'tissue_general' & label =='lung'")
[2]:
| soma_joinid | organism | category | ontology_term_id | unique_cell_count | total_cell_count | label | |
|---|---|---|---|---|---|---|---|
| 940 | 940 | Homo sapiens | tissue_general | UBERON:0002048 | 2247328 | 4525303 | lung |
There you can see the total of cells of under total_cell_count and the unique number cells under unique_cell_count (i.e. after removing cells that were included in multiple datasets).
Let’s now take a look at the cell and gene information of this slice of the Census.
Learning about cells of lung data
Let’s load the cell metadata for all lung cells and select only the unique cells using is_primary_data.
[3]:
lung_obs = (
    census["census_data"]["homo_sapiens"]
    .obs.read(value_filter="tissue_general == 'lung' and is_primary_data == True")
    .concat()
    .to_pandas()
)
lung_obs
[3]:
| soma_joinid | dataset_id | assay | assay_ontology_term_id | cell_type | cell_type_ontology_term_id | development_stage | development_stage_ontology_term_id | disease | disease_ontology_term_id | ... | is_primary_data | self_reported_ethnicity | self_reported_ethnicity_ontology_term_id | sex | sex_ontology_term_id | suspension_type | tissue | tissue_ontology_term_id | tissue_general | tissue_general_ontology_term_id | |
|---|---|---|---|---|---|---|---|---|---|---|---|---|---|---|---|---|---|---|---|---|---|
| 0 | 231923 | d8da613f-e681-4c69-b463-e94f5e66847f | 10x 3' v3 | EFO:0009922 | lung ciliated cell | CL:1000271 | 70-year-old human stage | HsapDv:0000164 | normal | PATO:0000461 | ... | True | European | HANCESTRO:0005 | female | PATO:0000383 | nucleus | lung | UBERON:0002048 | lung | UBERON:0002048 |
| 1 | 231924 | d8da613f-e681-4c69-b463-e94f5e66847f | 10x 3' v3 | EFO:0009922 | alveolar macrophage | CL:0000583 | 70-year-old human stage | HsapDv:0000164 | normal | PATO:0000461 | ... | True | European | HANCESTRO:0005 | female | PATO:0000383 | nucleus | lung | UBERON:0002048 | lung | UBERON:0002048 |
| 2 | 231925 | d8da613f-e681-4c69-b463-e94f5e66847f | 10x 3' v3 | EFO:0009922 | lung ciliated cell | CL:1000271 | 70-year-old human stage | HsapDv:0000164 | normal | PATO:0000461 | ... | True | European | HANCESTRO:0005 | female | PATO:0000383 | nucleus | lung | UBERON:0002048 | lung | UBERON:0002048 |
| 3 | 231926 | d8da613f-e681-4c69-b463-e94f5e66847f | 10x 3' v3 | EFO:0009922 | lung ciliated cell | CL:1000271 | 70-year-old human stage | HsapDv:0000164 | normal | PATO:0000461 | ... | True | European | HANCESTRO:0005 | female | PATO:0000383 | nucleus | lung | UBERON:0002048 | lung | UBERON:0002048 |
| 4 | 231927 | d8da613f-e681-4c69-b463-e94f5e66847f | 10x 3' v3 | EFO:0009922 | lung ciliated cell | CL:1000271 | 70-year-old human stage | HsapDv:0000164 | normal | PATO:0000461 | ... | True | European | HANCESTRO:0005 | female | PATO:0000383 | nucleus | lung | UBERON:0002048 | lung | UBERON:0002048 |
| ... | ... | ... | ... | ... | ... | ... | ... | ... | ... | ... | ... | ... | ... | ... | ... | ... | ... | ... | ... | ... | ... |
| 2247323 | 39998183 | 53d208b0-2cfd-4366-9866-c3c6114081bc | Smart-seq2 | EFO:0008931 | macrophage | CL:0000235 | 61-year-old human stage | HsapDv:0000155 | normal | PATO:0000461 | ... | True | African American or Afro-Caribbean | HANCESTRO:0016 | female | PATO:0000383 | cell | lung | UBERON:0002048 | lung | UBERON:0002048 |
| 2247324 | 39998184 | 53d208b0-2cfd-4366-9866-c3c6114081bc | Smart-seq2 | EFO:0008931 | plasma cell | CL:0000786 | 61-year-old human stage | HsapDv:0000155 | normal | PATO:0000461 | ... | True | African American or Afro-Caribbean | HANCESTRO:0016 | female | PATO:0000383 | cell | lung | UBERON:0002048 | lung | UBERON:0002048 |
| 2247325 | 39998185 | 53d208b0-2cfd-4366-9866-c3c6114081bc | Smart-seq2 | EFO:0008931 | lung microvascular endothelial cell | CL:2000016 | 61-year-old human stage | HsapDv:0000155 | normal | PATO:0000461 | ... | True | African American or Afro-Caribbean | HANCESTRO:0016 | female | PATO:0000383 | cell | lung | UBERON:0002048 | lung | UBERON:0002048 |
| 2247326 | 39998186 | 53d208b0-2cfd-4366-9866-c3c6114081bc | Smart-seq2 | EFO:0008931 | neutrophil | CL:0000775 | 61-year-old human stage | HsapDv:0000155 | normal | PATO:0000461 | ... | True | African American or Afro-Caribbean | HANCESTRO:0016 | female | PATO:0000383 | cell | lung | UBERON:0002048 | lung | UBERON:0002048 |
| 2247327 | 39998187 | 53d208b0-2cfd-4366-9866-c3c6114081bc | Smart-seq2 | EFO:0008931 | type II pneumocyte | CL:0002063 | 61-year-old human stage | HsapDv:0000155 | normal | PATO:0000461 | ... | True | African American or Afro-Caribbean | HANCESTRO:0016 | female | PATO:0000383 | cell | lung | UBERON:0002048 | lung | UBERON:0002048 |
2247328 rows × 21 columns
You can see that the number or rows represents the total number of unique lung cells in the Census. Now let’s take a deeper dive into the characteristics of these cells.
Datasets
First let’s start by looking at what are the datasets and collections from CELLxGENE Discover contributing to lung. For this we will use the dataset table at census["census-info"]["datasets"] that contains metadata of all datasets used to build this Census.
[4]:
census_datasets = (
    census["census_info"]["datasets"]
    .read(column_names=["collection_name", "dataset_title", "dataset_id", "soma_joinid"])
    .concat()
    .to_pandas()
)
census_datasets = census_datasets.set_index("dataset_id")
census_datasets
[4]:
| collection_name | dataset_title | soma_joinid | |
|---|---|---|---|
| dataset_id | |||
| f512b8b6-369d-4a85-a695-116e0806857f | Transcriptional Programming of Normal and Infl... | Skin | 0 |
| 90d4a63b-5c02-43eb-acde-c49345681601 | A molecular atlas of the human postmenopausal ... | Fallopian tube RNA | 1 |
| d1207c81-7309-43a7-a5a0-f4283670b62b | A molecular atlas of the human postmenopausal ... | Ovary RNA | 2 |
| 36c867a7-be10-4e69-9b39-5de12b0af6da | Single-Cell Analysis of Crohn’s Disease Lesion... | Ileum | 3 |
| 58b01044-c5e5-4b0f-8a2d-6ebf951e01ff | Humoral immunity at the brain borders in homeo... | A scRNA-seq atlas of immune cells at the CNS b... | 4 |
| ... | ... | ... | ... |
| 63bb6359-3945-4658-92eb-3072419953e4 | Single-cell RNA sequencing unifies development... | UMAP of T-Cells cells | 517 |
| 94423ec1-21f8-40e8-b5c9-c3ea82350ca4 | Single-cell RNA sequencing unifies development... | UMAP of Myeloid cells | 518 |
| 773b9b2e-70c8-40be-8cbb-e7b5abab360d | Single-cell RNA sequencing unifies development... | UMAP of Columnar cells | 519 |
| e5233a94-9e43-418c-8209-6f1400c31530 | Single-cell RNA sequencing unifies development... | UMAP of all data | 520 |
| be884a28-0eac-4eca-9c23-1294a93cf56e | Intratumoral heterogeneity in recurrent pediat... | Intratumoral heterogeneity in recurrent pediat... | 521 |
522 rows × 3 columns
The obs cell metadata pandas.DataFrame contains a column dataset_id that can be used for joining to the census_dataset pandas.DataFrame we just created.
So let’s take a look at the cell counts per dataset_id of the lung slice and then join to the dataset table to append the human-readable labels.
[5]:
dataset_cell_counts = pd.DataFrame(lung_obs[["dataset_id"]].value_counts())
dataset_cell_counts = dataset_cell_counts.rename(columns={0: "cell_counts"})
dataset_cell_counts = dataset_cell_counts.merge(census_datasets, on="dataset_id")

dataset_cell_counts
[5]:
| count | collection_name | dataset_title | soma_joinid | |
|---|---|---|---|---|
| dataset_id | ||||
| 1e6a6ef9-7ec9-4c90-bbfb-2ad3c3165fd1 | 1028006 | High-resolution single-cell atlas reveals dive... | The single-cell lung cancer atlas (LuCA) -- ex... | 298 |
| 066943a2-fdac-4b29-b348-40cede398e4e | 254931 | The integrated Human Lung Cell Atlas | The integrated Human Lung Cell Atlas | 220 |
| f7c1c579-2dc0-47e2-ba19-8165c5a0e353 | 217738 | A human cell atlas of fetal gene expression | Survey of human embryonic development | 235 |
| d8da613f-e681-4c69-b463-e94f5e66847f | 116313 | A molecular single-cell lung atlas of lethal C... | A molecular single-cell lung atlas of lethal C... | 6 |
| 576f193c-75d0-4a11-bd25-8676587e6dc2 | 90384 | HTAN MSK - Single cell profiling reveals novel... | Combined samples | 392 |
| 3dc61ca1-ce40-46b6-8337-f27260fd9a03 | 71752 | A human fetal lung cell atlas uncovers proxima... | All cells | 78 |
| 8c42cfd0-0b0a-46d5-910c-fc833d83c45e | 60993 | A molecular cell atlas of the human lung from ... | Krasnow Lab Human Lung Cell Atlas, 10X | 318 |
| 2672b679-8048-4f5e-9786-f1b196ccfd08 | 57019 | scRNA-seq assessment of the human lung, spleen... | Lung Parenchyma | 469 |
| 9dbab10c-118d-496b-966a-67f1763a6b7d | 49014 | COVID-19 immune features revealed by a large-s... | Large-scale single-cell analysis reveals criti... | 66 |
| 3de0ad6d-4378-4f62-b37b-ec0b75a50d94 | 46500 | LungMAP — Human data from a broad age healthy ... | Single-cell multiomic profiling of human lungs... | 329 |
| 2f132ec9-24b5-422f-9be0-ccef03b4fe28 | 39778 | SARS-CoV-2 receptor ACE2 and TMPRSS2 are prima... | Lung | 245 |
| 1e5bd3b8-6a0e-4959-8d69-cafed30fe814 | 35699 | Emphysema Cell Atlas | immune cells | 53 |
| 53d208b0-2cfd-4366-9866-c3c6114081bc | 35682 | Tabula Sapiens | Tabula Sapiens - All Cells | 491 |
| 1b9d8702-5af8-4142-85ed-020eb06ec4f6 | 35419 | Cross-tissue immune cell analysis reveals tiss... | Global | 466 |
| 4ed927e9-c099-49af-b8ce-a2652d069333 | 35284 | Single-nucleus cross-tissue molecular referenc... | Single-nucleus cross-tissue molecular referenc... | 65 |
| 2adb1f8a-a6b1-4909-8ee8-484814e2d4bf | 33698 | Construction of a human cell landscape at sing... | Construction of a human cell landscape at sing... | 396 |
| 4b6af54a-4a21-46e0-bc8d-673c0561a836 | 15495 | Emphysema Cell Atlas | non-immune cells | 55 |
| 01209dce-3575-4bed-b1df-129f57fbc031 | 11059 | Single-cell transcriptomics of human T cells r... | Single-cell transcriptomics of human T cells r... | 327 |
| e04daea4-4412-45b5-989e-76a9be070a89 | 8657 | A molecular cell atlas of the human lung from ... | Krasnow Lab Human Lung Cell Atlas, Smart-seq2 | 317 |
| 214bf9eb-93db-48c8-8e3c-9bb22fa3bc63 | 3662 | Emphysema Cell Atlas | AT2 cells | 54 |
| f9846bb4-784d-4582-92c1-3f279e4c6f0c | 176 | A human fetal lung cell atlas uncovers proxima... | Fibroblast and smooth muscle | 74 |
| f64e1be1-de15-4d27-8da4-82225cd4c035 | 55 | HTAN MSK - Single cell profiling reveals novel... | Immune cells | 393 |
| 810ac45f-8969-4698-b42c-652f802f75c2 | 10 | A human fetal lung cell atlas uncovers proxima... | Endothelium | 80 |
| 0ba16f4b-cb87-4fa3-9363-19fc51eec6e7 | 4 | A human fetal lung cell atlas uncovers proxima... | Myeloid | 77 |
These are all the datasets lung cells whose counts are reprensented in the column cell_counts. The top collections with lung data are:
Assays
Let’s use similar logic to take a look at all the assays available for human lung data. This tells us that most assays are from 10x technologies and sci-RNA-seq.
[6]:
lung_obs[["assay"]].value_counts()
[6]:
assay
10x 3' v2                                   1039302
10x 3' v3                                    436291
10x 5' v1                                    218556
sci-RNA-seq                                  217738
BD Rhapsody Whole Transcriptome Analysis     122902
single cell library construction              58981
10x 5' v2                                     45798
microwell-seq                                 33698
Smart-seq2                                    25662
inDrop                                        25652
10x 3' v1                                     11558
Drop-seq                                       7333
10x 3' transcription profiling                 3857
Name: count, dtype: int64
Disease
And now let’s take a look at diseased cell counts, with normal indicating non-diseased cells.
[7]:
lung_obs[["disease"]].value_counts()
[7]:
disease
normal                                   1063657
lung adenocarcinoma                       626322
squamous cell lung carcinoma              189044
COVID-19                                  128650
non-small cell lung carcinoma             120796
chronic obstructive pulmonary disease      55254
pulmonary emphysema                        32065
small cell lung carcinoma                  31540
Name: count, dtype: int64
Sex
There doesn’t seem to be strong biases for sex.
[8]:
lung_obs[["sex"]].value_counts()
[8]:
sex
male       1256251
female      983554
unknown       7523
Name: count, dtype: int64
Cell vs nucleus
The majority of data are from cells and not nucleus.
[9]:
lung_obs[["suspension_type"]].value_counts()
[9]:
suspension_type
cell               1831493
nucleus             415835
Name: count, dtype: int64
Cell types
Let’s take a look at the counts of the top 20 cell types.
[10]:
lung_obs[["cell_type"]].value_counts().head(20)
[10]:
cell_type
alveolar macrophage                           244502
CD4-positive, alpha-beta T cell               185787
macrophage                                    154415
CD8-positive, alpha-beta T cell               152746
type II pneumocyte                            143252
epithelial cell of lower respiratory tract    101959
classical monocyte                             90969
natural killer cell                            90715
stromal cell                                   87587
malignant cell                                 75917
B cell                                         61715
T cell                                         53703
fibroblast                                     41934
plasma cell                                    41907
fibroblast of lung                             41294
epithelial cell                                37424
regulatory T cell                              36381
epithelial cell of lung                        33940
monocyte                                       33154
endothelial cell                               30701
Name: count, dtype: int64
Sub-tissues
We can look at the original tissue annotations that were mapped to “lung”.
[11]:
lung_obs[["tissue"]].value_counts()
[11]:
tissue
lung                       1834179
lung parenchyma             311950
alveolus of lung             54856
lingula of left lung         35284
lower lobe of left lung      11059
Name: count, dtype: int64
Learning about genes of lung data
Let’s load the gene metadata of the Census.
[12]:
lung_var = census["census_data"]["homo_sapiens"].ms["RNA"].var.read().concat().to_pandas()
lung_var
[12]:
| soma_joinid | feature_id | feature_name | feature_length | |
|---|---|---|---|---|
| 0 | 0 | ENSG00000238009 | RP11-34P13.7 | 3726 |
| 1 | 1 | ENSG00000279457 | WASH9P | 1397 |
| 2 | 2 | ENSG00000228463 | AP006222.1 | 8224 |
| 3 | 3 | ENSG00000237094 | RP4-669L17.4 | 6204 |
| 4 | 4 | ENSG00000230021 | RP11-206L10.17 | 5495 |
| ... | ... | ... | ... | ... |
| 60659 | 60659 | ENSG00000288719 | RP4-669P10.21 | 4252 |
| 60660 | 60660 | ENSG00000288720 | RP11-852E15.3 | 7007 |
| 60661 | 60661 | ENSG00000288721 | RP5-973N23.5 | 7765 |
| 60662 | 60662 | ENSG00000288723 | RP11-553N16.6 | 1015 |
| 60663 | 60663 | ENSG00000288724 | RP13-546I2.2 | 625 |
60664 rows × 4 columns
You can see the total number of genes represented by the number of rows. This number is actually misleading because it is the join of all genes in the Census. However we know that the lung data comes from a subset of datasets.
So let’s take a look at the number of genes that were measured in each of those datasets.
To accomplish this we can use the “dataset presence matrix” at census["census_data"]["homo_sapiens"].ms["RNA"]["feature_dataset_presence_matrix"]. This is a boolean matrix N x M where N is the number of datasets and M is the number of genes in the Census.
So we can select the rows corresponding to the lung datasets and perform a row-wise sum.
[13]:
presence_matrix = cellxgene_census.get_presence_matrix(census, "Homo sapiens", "RNA")
presence_matrix = presence_matrix[dataset_cell_counts.soma_joinid, :]
[14]:
presence_matrix.sum(axis=1).A1
[14]:
array([17811, 28024, 44150, 34265, 22447, 26347, 20921, 24672, 27705,
       26323, 27181, 23203, 57030, 32610, 29620, 26454, 23705, 38676,
       47307, 21641, 23740, 22552, 20594, 19952], dtype=uint64)
[15]:
genes_measured = presence_matrix.sum(axis=1).A1
dataset_cell_counts["genes_measured"] = genes_measured
dataset_cell_counts
[15]:
| count | collection_name | dataset_title | soma_joinid | genes_measured | |
|---|---|---|---|---|---|
| dataset_id | |||||
| 1e6a6ef9-7ec9-4c90-bbfb-2ad3c3165fd1 | 1028006 | High-resolution single-cell atlas reveals dive... | The single-cell lung cancer atlas (LuCA) -- ex... | 298 | 17811 |
| 066943a2-fdac-4b29-b348-40cede398e4e | 254931 | The integrated Human Lung Cell Atlas | The integrated Human Lung Cell Atlas | 220 | 28024 |
| f7c1c579-2dc0-47e2-ba19-8165c5a0e353 | 217738 | A human cell atlas of fetal gene expression | Survey of human embryonic development | 235 | 44150 |
| d8da613f-e681-4c69-b463-e94f5e66847f | 116313 | A molecular single-cell lung atlas of lethal C... | A molecular single-cell lung atlas of lethal C... | 6 | 34265 |
| 576f193c-75d0-4a11-bd25-8676587e6dc2 | 90384 | HTAN MSK - Single cell profiling reveals novel... | Combined samples | 392 | 22447 |
| 3dc61ca1-ce40-46b6-8337-f27260fd9a03 | 71752 | A human fetal lung cell atlas uncovers proxima... | All cells | 78 | 26347 |
| 8c42cfd0-0b0a-46d5-910c-fc833d83c45e | 60993 | A molecular cell atlas of the human lung from ... | Krasnow Lab Human Lung Cell Atlas, 10X | 318 | 20921 |
| 2672b679-8048-4f5e-9786-f1b196ccfd08 | 57019 | scRNA-seq assessment of the human lung, spleen... | Lung Parenchyma | 469 | 24672 |
| 9dbab10c-118d-496b-966a-67f1763a6b7d | 49014 | COVID-19 immune features revealed by a large-s... | Large-scale single-cell analysis reveals criti... | 66 | 27705 |
| 3de0ad6d-4378-4f62-b37b-ec0b75a50d94 | 46500 | LungMAP — Human data from a broad age healthy ... | Single-cell multiomic profiling of human lungs... | 329 | 26323 |
| 2f132ec9-24b5-422f-9be0-ccef03b4fe28 | 39778 | SARS-CoV-2 receptor ACE2 and TMPRSS2 are prima... | Lung | 245 | 27181 |
| 1e5bd3b8-6a0e-4959-8d69-cafed30fe814 | 35699 | Emphysema Cell Atlas | immune cells | 53 | 23203 |
| 53d208b0-2cfd-4366-9866-c3c6114081bc | 35682 | Tabula Sapiens | Tabula Sapiens - All Cells | 491 | 57030 |
| 1b9d8702-5af8-4142-85ed-020eb06ec4f6 | 35419 | Cross-tissue immune cell analysis reveals tiss... | Global | 466 | 32610 |
| 4ed927e9-c099-49af-b8ce-a2652d069333 | 35284 | Single-nucleus cross-tissue molecular referenc... | Single-nucleus cross-tissue molecular referenc... | 65 | 29620 |
| 2adb1f8a-a6b1-4909-8ee8-484814e2d4bf | 33698 | Construction of a human cell landscape at sing... | Construction of a human cell landscape at sing... | 396 | 26454 |
| 4b6af54a-4a21-46e0-bc8d-673c0561a836 | 15495 | Emphysema Cell Atlas | non-immune cells | 55 | 23705 |
| 01209dce-3575-4bed-b1df-129f57fbc031 | 11059 | Single-cell transcriptomics of human T cells r... | Single-cell transcriptomics of human T cells r... | 327 | 38676 |
| e04daea4-4412-45b5-989e-76a9be070a89 | 8657 | A molecular cell atlas of the human lung from ... | Krasnow Lab Human Lung Cell Atlas, Smart-seq2 | 317 | 47307 |
| 214bf9eb-93db-48c8-8e3c-9bb22fa3bc63 | 3662 | Emphysema Cell Atlas | AT2 cells | 54 | 21641 |
| f9846bb4-784d-4582-92c1-3f279e4c6f0c | 176 | A human fetal lung cell atlas uncovers proxima... | Fibroblast and smooth muscle | 74 | 23740 |
| f64e1be1-de15-4d27-8da4-82225cd4c035 | 55 | HTAN MSK - Single cell profiling reveals novel... | Immune cells | 393 | 22552 |
| 810ac45f-8969-4698-b42c-652f802f75c2 | 10 | A human fetal lung cell atlas uncovers proxima... | Endothelium | 80 | 20594 |
| 0ba16f4b-cb87-4fa3-9363-19fc51eec6e7 | 4 | A human fetal lung cell atlas uncovers proxima... | Myeloid | 77 | 19952 |
You can see the genes measured in each dataset represented in genes_measured. Now lets get the genes that were measured in all datasets.
[16]:
var_somaid = np.nonzero(presence_matrix.sum(axis=0).A1 == presence_matrix.shape[0])[0].tolist()
[17]:
lung_var = lung_var.query(f"soma_joinid in {var_somaid}")
lung_var
[17]:
| soma_joinid | feature_id | feature_name | feature_length | |
|---|---|---|---|---|
| 6 | 6 | ENSG00000177757 | FAM87B | 1947 |
| 8 | 8 | ENSG00000230368 | FAM41C | 1971 |
| 10 | 10 | ENSG00000187634 | SAMD11 | 4172 |
| 11 | 11 | ENSG00000188976 | NOC2L | 5540 |
| 12 | 12 | ENSG00000187961 | KLHL17 | 3402 |
| ... | ... | ... | ... | ... |
| 40597 | 40597 | ENSG00000248441 | LINC01197 | 13970 |
| 43612 | 43612 | ENSG00000253309 | SERPINE3 | 2608 |
| 49449 | 49449 | ENSG00000264707 | L3MBTL4-AS1 | 2044 |
| 50736 | 50736 | ENSG00000267586 | LINC00907 | 10962 |
| 51012 | 51012 | ENSG00000268388 | FENDRR | 6880 |
11818 rows × 4 columns
The number of rows represents the genes that were measured in all lung datasets.
Summary of lung metadata
In the previous sections, using the Census we learned the following information:
The total number of unique lung cells and their composition for:
Number of datasets.
Number sequencing technologies, most of which are 10x
Mostly human data, but some diseases exist, primarily “lung adenocarcinoma” and “COVID-19 infected”
No sex biases.
Mostly data from cells (~80%) rather than nucleus (~20%)
A total of ~12k genes were measured across all cells.
Fetching a sample of all human lung data from the Census.
Since loading the entire lung data is resource-intensive, for the sake of this exercise let’s load a subset of the lung data into an anndata.AnnData object and perform some exploratory analysis.
We will subset to 100,000 random unique cells using the lung_obs pandas.DataFrame we previously created.
[18]:
lung_cell_subsampled_n = 100000
lung_cell_subsampled_ids = lung_obs["soma_joinid"].sample(lung_cell_subsampled_n, random_state=1).tolist()
Now we can directly use the values of soma_joinid for querying the Census data and obtaining an AnnData object.
[19]:
lung_gene_ids = lung_var["soma_joinid"].to_numpy()
lung_adata = cellxgene_census.get_anndata(
    census,
    organism="Homo sapiens",
    obs_coords=lung_cell_subsampled_ids,
    var_coords=lung_gene_ids,
)

lung_adata.var_names = lung_adata.var["feature_name"]
[20]:
lung_adata
[20]:
AnnData object with n_obs × n_vars = 100000 × 11818
    obs: 'soma_joinid', 'dataset_id', 'assay', 'assay_ontology_term_id', 'cell_type', 'cell_type_ontology_term_id', 'development_stage', 'development_stage_ontology_term_id', 'disease', 'disease_ontology_term_id', 'donor_id', 'is_primary_data', 'self_reported_ethnicity', 'self_reported_ethnicity_ontology_term_id', 'sex', 'sex_ontology_term_id', 'suspension_type', 'tissue', 'tissue_ontology_term_id', 'tissue_general', 'tissue_general_ontology_term_id'
    var: 'soma_joinid', 'feature_id', 'feature_name', 'feature_length'
We are done with the census, so close it
[21]:
census.close()
del census
QC metrics on gene expression of all Lung data
Now let’s take a look at some QC metrics
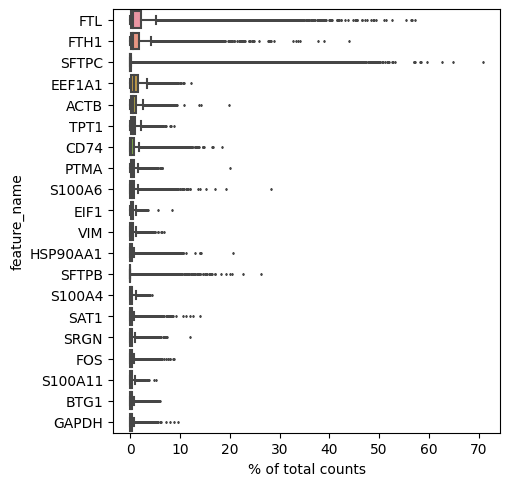
Top genes per cell
[22]:
sc.pl.highest_expr_genes(lung_adata, n_top=20)
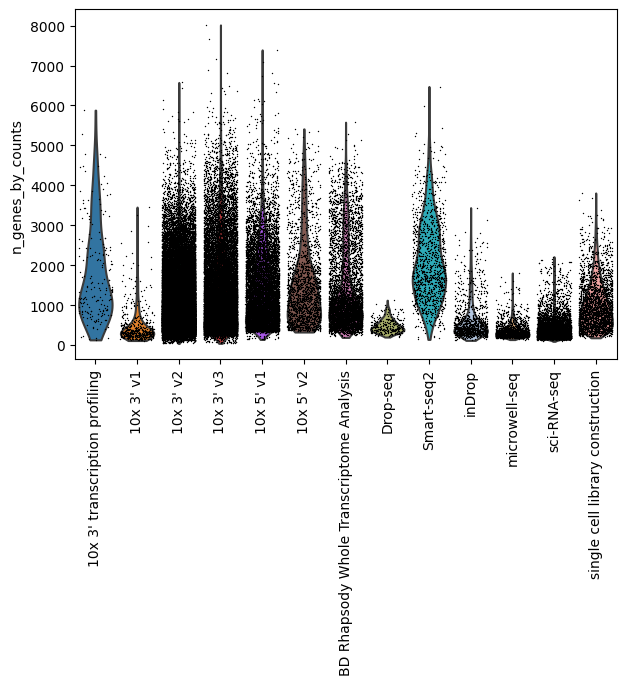
Number of sequenced genes by assay
[23]:
sc.pp.calculate_qc_metrics(lung_adata, percent_top=None, log1p=False, inplace=True)
sc.pl.violin(lung_adata, "n_genes_by_counts", groupby="assay", jitter=0.4, rotation=90)
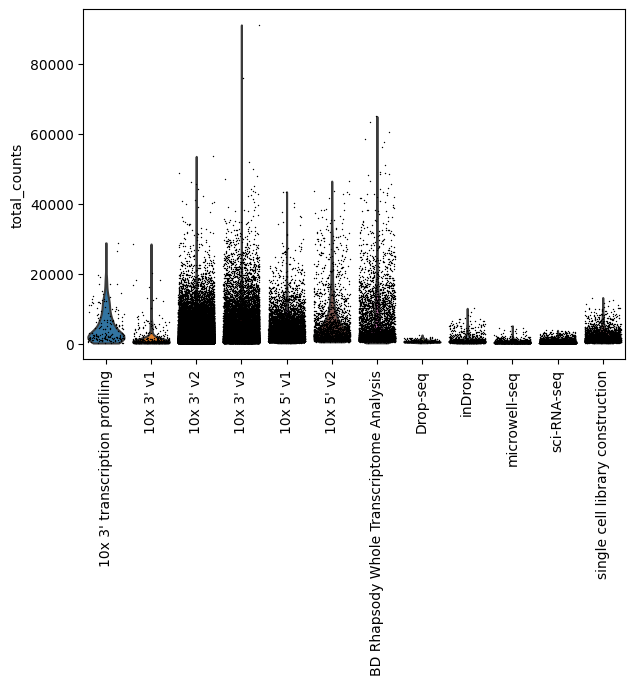
Total counts by assay
[24]:
sc.pl.violin(lung_adata, "total_counts", groupby="assay", jitter=0.4, rotation=90)
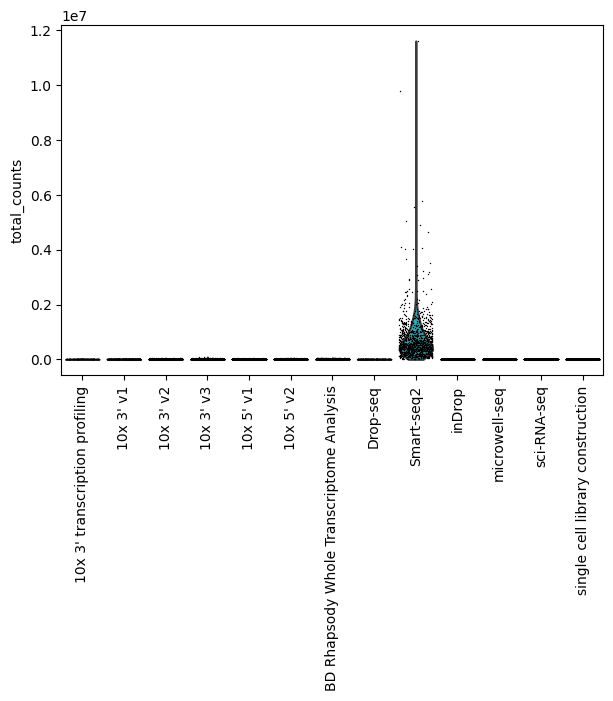
You can see that Smart-Seq2 is an outlier for the total counts per cell, so let’s exlcude it to see how the rest of the assays look like
[25]:
sc.pl.violin(
    lung_adata[lung_adata.obs["assay"] != "Smart-seq2",],
    "total_counts",
    groupby="assay",
    jitter=0.4,
    rotation=90,
)
Quick normalization and embeddings
Let’s perform a bread and butter normalization and take a look at UMAP embeddings, but for all the data below we’ll exclude Smart-seq2 as this requires an extra step to normalize based on gene lengths
[26]:
lung_adata = lung_adata[lung_adata.obs["assay"] != "Smart-seq2",].copy()
lung_adata.layers["counts"] = lung_adata.X
Now let’s do some basic normalization:
Normalize by sequencing depth
Transform to log-scale
Select 500 highly variable genes
Scale values across the gene axis
[27]:
sc.pp.normalize_total(lung_adata, target_sum=1e4)
sc.pp.log1p(lung_adata)
sc.pp.highly_variable_genes(lung_adata, n_top_genes=500, flavor="seurat_v3", layer="counts")
lung_adata = lung_adata[:, lung_adata.var.highly_variable]
sc.pp.scale(lung_adata, max_value=10)
/home/ubuntu/venv-notebooks/lib/python3.10/site-packages/scanpy/preprocessing/_highly_variable_genes.py:62: UserWarning: `flavor='seurat_v3'` expects raw count data, but non-integers were found.
  warnings.warn(
/home/ubuntu/venv-notebooks/lib/python3.10/site-packages/scanpy/preprocessing/_simple.py:843: UserWarning: Received a view of an AnnData. Making a copy.
  view_to_actual(adata)
And reduce dimensionality by obtaining UMAP embeddings.
[28]:
sc.tl.pca(lung_adata)
sc.pp.neighbors(lung_adata)
sc.tl.umap(lung_adata)
/home/ubuntu/venv-notebooks/lib/python3.10/site-packages/tqdm/auto.py:21: TqdmWarning: IProgress not found. Please update jupyter and ipywidgets. See https://ipywidgets.readthedocs.io/en/stable/user_install.html
  from .autonotebook import tqdm as notebook_tqdm
And plot these embeddings.
[29]:
n_cell_types = len(lung_adata.obs["cell_type"].drop_duplicates())

from random import randint

colors = []

for i in range(len(lung_adata.obs["cell_type"].drop_duplicates())):
    colors.append("#%06X" % randint(0, 0xFFFFFF))
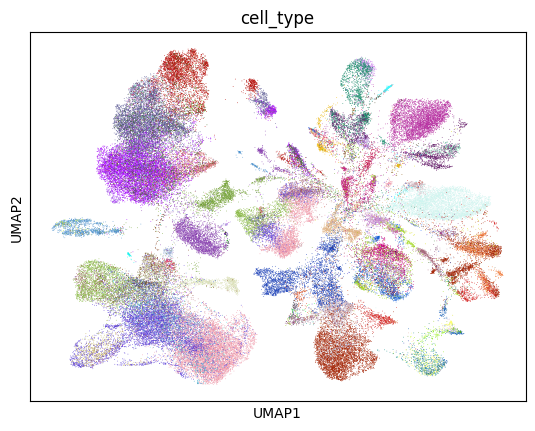
[30]:
sc.pl.umap(lung_adata, color="cell_type", palette=colors, legend_loc=None)
/home/ubuntu/venv-notebooks/lib/python3.10/site-packages/scanpy/plotting/_tools/scatterplots.py:392: UserWarning: No data for colormapping provided via 'c'. Parameters 'cmap' will be ignored
  cax = scatter(
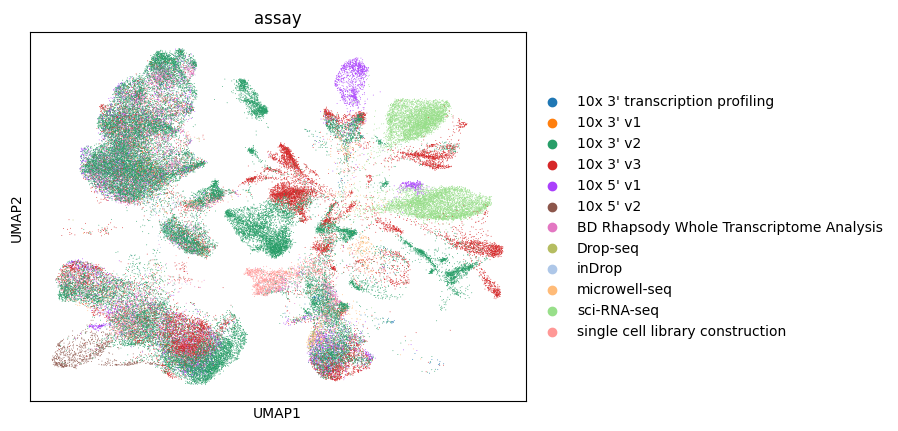
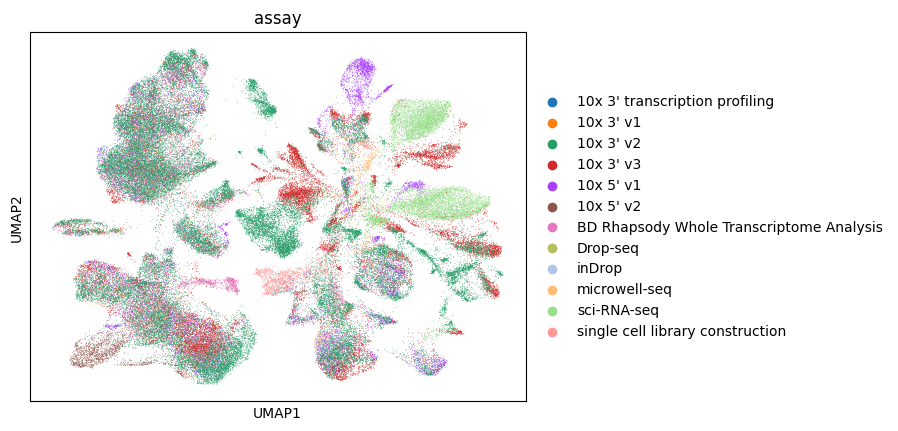
Let’s color by assay.
[31]:
sc.pl.umap(lung_adata, color="assay")
/home/ubuntu/venv-notebooks/lib/python3.10/site-packages/scanpy/plotting/_tools/scatterplots.py:392: UserWarning: No data for colormapping provided via 'c'. Parameters 'cmap' will be ignored
  cax = scatter(
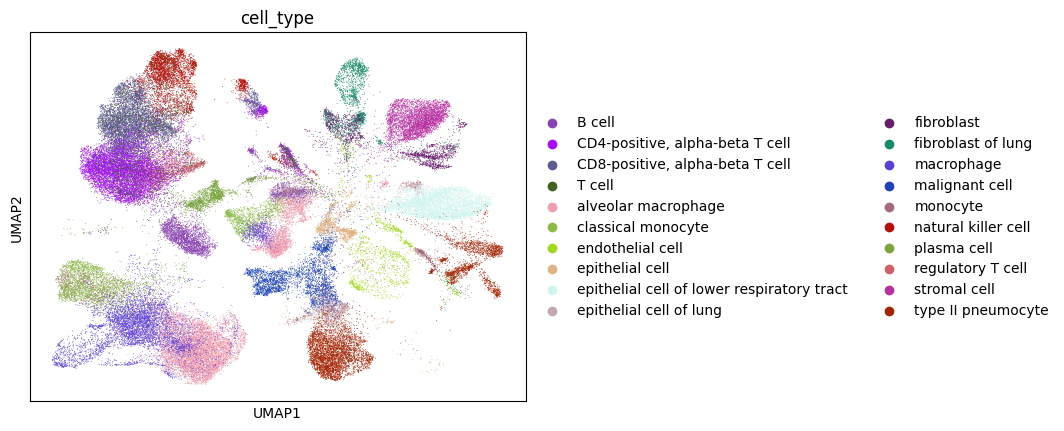
Given the high number of cell types it makes it hard to visualize, so let’s look at the top 20 most abundant cell types.
[32]:
top_cell_types = lung_adata.obs["cell_type"].value_counts()
top_cell_types = list(top_cell_types.reset_index().head(20)["cell_type"])
[33]:
lung_adata_top_cell_types = lung_adata[[i in top_cell_types for i in lung_adata.obs["cell_type"]], :]
sc.pl.umap(lung_adata_top_cell_types, color="cell_type")
/home/ubuntu/venv-notebooks/lib/python3.10/site-packages/scanpy/plotting/_tools/scatterplots.py:392: UserWarning: No data for colormapping provided via 'c'. Parameters 'cmap' will be ignored
  cax = scatter(
Let’s color by assay of this subset of the data.
[34]:
sc.pl.umap(lung_adata_top_cell_types, color="assay")
/home/ubuntu/venv-notebooks/lib/python3.10/site-packages/scanpy/plotting/_tools/scatterplots.py:392: UserWarning: No data for colormapping provided via 'c'. Parameters 'cmap' will be ignored
  cax = scatter(